3.2. Customer Satisfaction, Sales & Market Practice
We see fair practices as the only tools that can help us show respect for the development of the market and its demanding requirements. We also respect our competitors and focus primarily on the needs of the market. We will always be ready to develop new services and approaches to continue to be one of the leading mobility providers in Romania.
Explaining the impact
Material aspect
Economic impact
Social impact
Environmental impact
Customer Satisfaction, Sales & Market Practice
Continuously improving the quality of the services that we offer is only possible by reflecting on customer feedback. By focusing on market needs and fair business practices we ensure business continuity while meeting the associated legislative requirements.
In the field we operate in, the quality of service we provide includes promoting customer safety. To avoid accidents, we conduct internal and external preventive driving courses for our partners and customers.
The sustainable mobility solutions we make available to customers in an easy and safe way, and the positive experiences we offer indirectly result in promoting sustainable consumption behaviour and directing customers towards more environmentally friendly mobility service options.
Managing the impact
According to the car rental procedures and the related contracts, we want to fully manage the maintenance and repair part of the rented cars and only occasionally leave this to the customers. Repairs are carried out with approved partners with whom Autonom has strict maintenance contracts for the vehicles. In this way we minimise the risks to the health and safety of our customers. Our specialised services we offer include constant preventive maintenance services for the cars in our contracted stock and warranty services for used cars sold.
We have a significant number of partners across the country who work closely with the Autonom teams to provide any repairs or services needed to maintain the vehicles and keep them in good working order.
Effectiveness of actions taken
Given the specialized services we offer and the quality of these services, our current clients recommend us to new clients.
The average fleet mileage is 27,000 km per car per year, so all vehicles have been thoroughly maintained according to manufacturers’ recommendations and wear and tear work in addition to the basic maintenance specified by the manufacturer.
In 2022, 164 cars were recalled for various reasons (ECU software update – 142 units, SOS system check – 12 units, airbag system check – 10 units). This number is down from 2021, when 190 cars were in this situation. Recalls come from the importer to Autonom and then we schedule via our call canter the interventions.
We work with customers and are close to their needs expressed through feedback. In this way, they provide us with the information we need for delivery, negotiation and service processes. By considering this feedback internally, we define approach strategies, control the intensity of communication and the flows between the different agencies/departments involved in the whole process evaluated.
Contributing to the improvement of service quality, starting from supervisors, colleagues, subordinates and customers, can improve the evolution of the organisational culture that is based on the quality of service provided.
This communication with customers is a direct reflection of the experience with our brand. There is no better way to learn more about our customers and the quality of service we provide than through feedback.
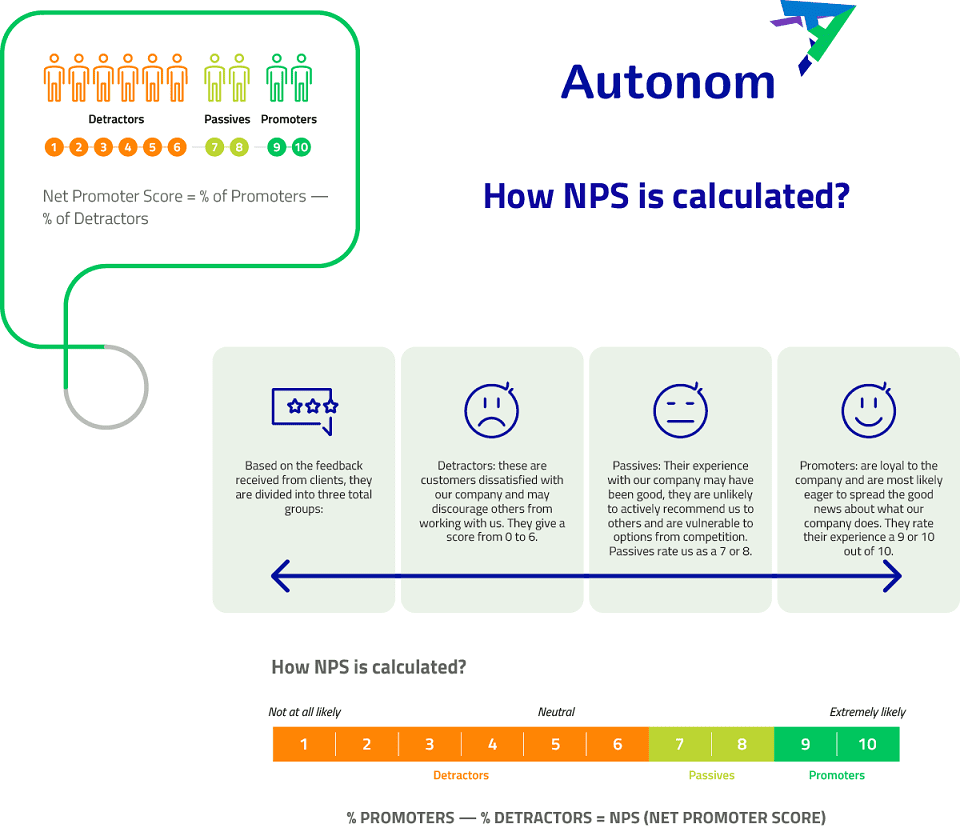
Our organisation’s culture is based on collecting feedback using the NPS (Net Promoter Score) method. The NPS method aims to increase the likelihood of being recommended by our customers. This method is characterised by asking a single question with the possibility to provide clarification or additional details (if necessary).
The NPS responses we record are divided into three total groups:
Detractors: these are customers who are likely to give a negative review because they have indicated that they were dissatisfied with our company. In fact, they may discourage others from working with us. Not only will they take their business elsewhere, but they may tell others to do the same. Out of a possible score of 10, detractors give a score from 0 to 6.
Passives: passives ranked their experience with the company higher than detractors. While their experience with our company may have been good, they are unlikely to actively recommend us to others. Passives rate their likelihood of recommending us to others as a 7 or 8.
Promoters: promoters rate our company the highest. They are likely to proactively recommend the brand. They are loyal to the company and are most likely eager to spread the good news about what our company does. Promoters rate their experience a 9 or 10 out of 10.
Basis for calculating the NPS score
An NPS score is compiled and calculated somewhere between -100 and 100. If all survey respondents answer with a six or less, it can give a score of -100. However, if all the scores are a 9 or a 10, this gives an NPS of 100. An NPS score of 50 or higher is considered a very reputable score, and a score of 75 or higher is extremely impressive.
Percentage of promoters = (Number of promoters / Total respondents) x 100 = (200/500) x 100 = 40%
Percentage of detractors = (Number of detractors/ Total respondents) x 100 = (100/500) x 100 = 20%
We can use the NPS formula to find the NPS score: NPS = % promoters – % detractors = 40–20% = 20%
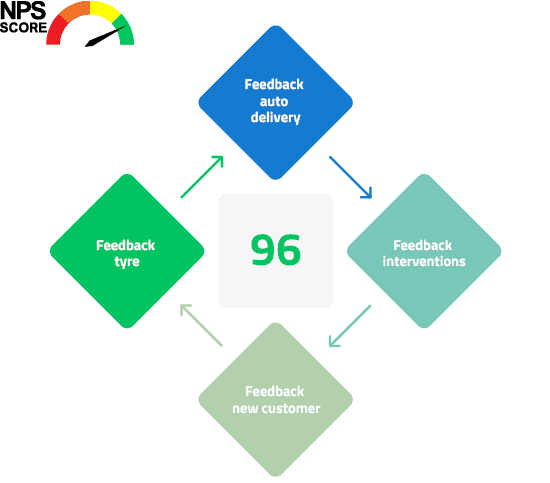
At 2022 level the average NPS level was calculated at 96, related to four categories: Deliveries, Interventions, New Customers and Tyre Change. Questionnaires at category level:
307 questionnaires to Feedback New Client (response rate 86%), NPS = 95
3062 questionnaires at Car Delivery Feedback (response rate 92%), NPS = 98
10605 surveys at Tyre Feedback (response rate 92%), NPS = 96
Towards the end of 2022 we have started, at our request, an external audit process related to the NPS scoring process as we want to get as good an interpretation as possible of the activities we carry out and see possible areas for improvement to address in the future.
Quality service for us means customer satisfaction
At the 2022 level, there were no incidents of non-compliance regarding the provision of product and service information, incidents of non-compliance regarding marketing communications. Our products and services, by the nature of our business, do not directly impact consumer health and safety.
Through our Google My Business pages we receive constant feedback and manage any compliance incidents. For the year 2022 we had a total of 632 reviews registered, of which 26 were negative and we discussed with customers.
Customer Safety
For the year 2022 the existing car fleet has not been monitored in terms of NCAP classification.
We continued our in-house preventive driving courses in 2022. We organised 28 courses attended by 301 colleagues. These courses were also carried out externally on request for various partners, totalling 150 participants in 9 external courses.