Global warming due to GHG (greenhouse gas) emissions from human activities is a challenge for mankind. We are committed to contribute to mitigating the effects of our company, directly and indirectly, with sustainable mobility as a future direction, a transition that is also in line with the requirements of our customers.
Explaining the impact
Material aspect
Economic impact
Social impact
Environmental impact
GHG Emissions and Climate Impact
Energy consumption from pollutingsources is not only a risk for theenvironment but also from an economic point of view. Indirect costs associated with carbon emissions are expected to increase with the transition to a green economy. Actions to reduce our company's carbon footprint are thus important for business resilience.
Climate change is a huge challenge for people and society. Through our monitoring and mitigation initiatives we aim to transparently show our impact and efforts to mitigate our contribution to these changes.
Reducing greenhouse gas emissions from our operations is a strategic objective that is monitored and reported annually. By making these calculations we can better understand and manage the activities associated with our most significant emissions and thus reduce our climate change impact year on year.
Managing the impact
In the process of structuring the Sustainability Strategy in 2021, an important awareness has been raised following the first calculation of our organisation’s carbon footprint (CCF). With the support of the consulting company denkstatt Romania and using as methodology for the inventory of CO2 emissions the GHG Protocol standard, we calculated the footprint by assessing Scope 1 (direct emissions), Scope 2(indirect emissions) and Scope 3 (indirect emissions), limited to the operational fleet, the most important part of the value chain in terms of direct use by our customers (rental – short and medium term and operational leasing – long term).
We considered this to be the right approach from a business point of view, as a significant proportion of the fleet is beyond direct control in terms of use, and therefore emissions generated through operation. This initiative was a very good time to understand the structure of the emissions generated by our business and the limitations of the impact we can have.
The GHG Protocol calculation showed that over 99% of our carbon footprint is in Scope 3 and relates to the fleet in direct use by our customers.
This approach has clearly become the source with the greatest potential for mitigating our environmental impact, as a result of which the main medium- and long-term objectives undertaken by Autonom through the Sustainability Strategy are reflected as direct objectives related to reducing this impact. Autonom has taken a conscious role in integrating and intensifying the transition to a low emission fleet through a concrete plan for the coming years, resulting from substitution scenarios and benchmarking in the medium (2025) and long term (2030), while increasing the understanding and awareness of the impact globally among our partners. Of course, the targets also considered the outlook for the automotive market and European transport regulations.
In the short-term rental fleet, the opportunity to intervene in the purchase decision and substitute a fossil-fuelled car with a lower emission vehicle is higher, although customer preferences in the rental area indicate minor changes in behaviour in recent years. The choice of primarily choosing such a car for commuting is still low, especially in longer distance rentals, which are directly dependent on the poorly developed electric charging infrastructure at national level.
Moreover, the fleet intended for long-term leasing, already engaged in operating leases, has an even lower possible substitution speed, generated both by customer preferences, increased charging time at the expense of the time required for productive activity, and by the capacity of the electricity grid and the reduced charging infrastructure geographically throughout Romania.
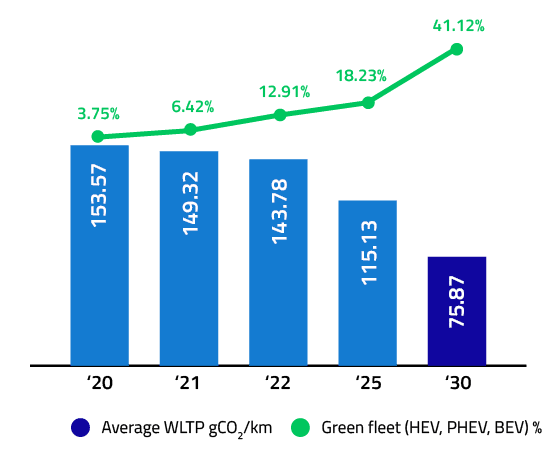
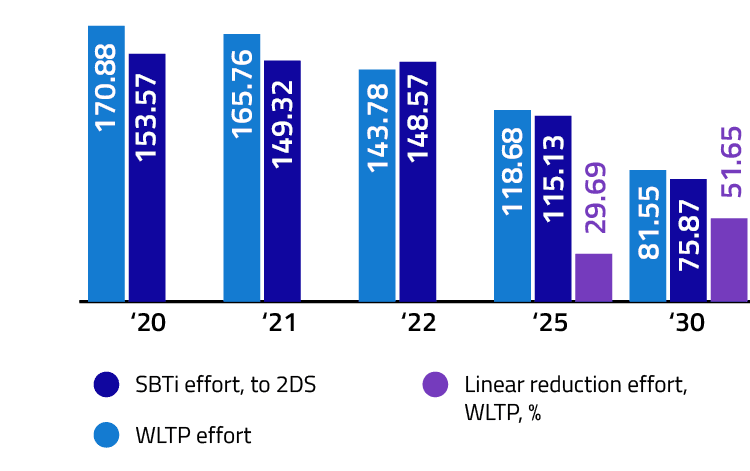
Taking into account the aspects mentioned above, as well as the close link with partners in the value chain upstream (car suppliers) and downstream (short, medium and long term customers) and with public authorities, we considered that the indicator that can best quantify both our activity and the relationship with the above mentioned partners is the WLTP (Worldwide Harmonised Light Vehicle Test Procedure) value measured in gCO2/km, available for each individual car based on manufacturer information and official documents of each car.
As a result, the environmental impact reduction scenarios over the 2020 – 2030-time horizon have taken as KPI the average WLTP of the active operational fleet, rent-a-car and operational leasing, at the end of each year.
The evolution of this WLTP indicator and progress towards the targets can be found in the following table:
Operational fleet at the end of the year
Reference 2020
Actual 2021
Real 2022
Objective 2025
Target 2030
Average WLTP CO2g/km
153.57
149.32
143.78
115.13
75.87
% discount
-
-3%
-6.4%
-25%
-51%
In terms of the share of low-emission cars in the total fleet and progress towards targets, there is a significant increase by 2022, achieved by integrating the first batches of electric cars into the operational fleet.
Year /
2020
2021
2022
2025
2030
HEV, PHEV, BEV fleet
3.75%
6.42%
12.91%
18.23%
41.13%
of which, electrical
0.49%
1.68%
2.21%
9.43%
27.39%
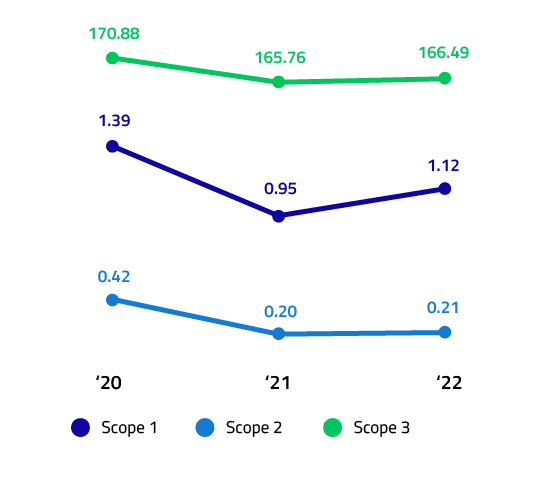
Total GHG emissions (tCO2)
Source of emissions
Unit
2020
2021
2022
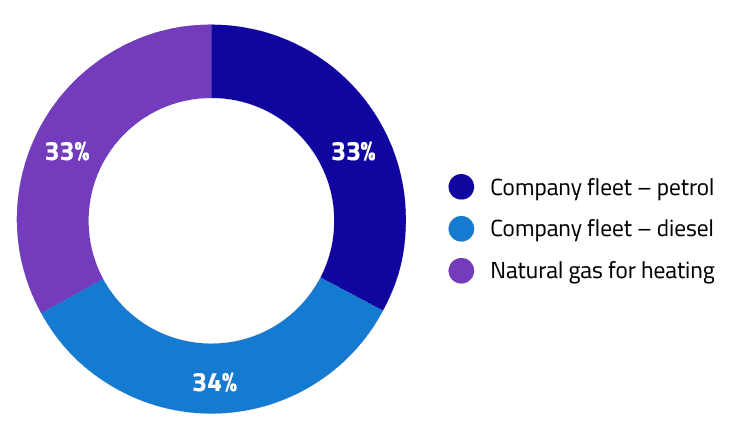
Scope 1
tCO2
262
250
395
Scope 2
tCO2
78
51
73
Scope 3 Note: We used the WRI & WBCSD Corporate Accounting and Reporting Standard for calculating the GHG (greenhouse gas) inventory.limited
tCO2
37,909
43,780
58,890
Total GHG Emissions (tCO2)Emisii GES, Domeniul de aplicare 3 (tCO2)
Effectiveness of actions taken
According to what was mentioned in the energy chapter, in 2022 we produced 50.28 MWh at the Piatra Neamt prosumer site and obtained 28 other compensations in the form of certificates of guarantees of origin equivalent to 18.21 MWh. This amount can offset 32% of the 73 tCO2 GHG emissions related to Scope 2, namely 23.55 tCO2.
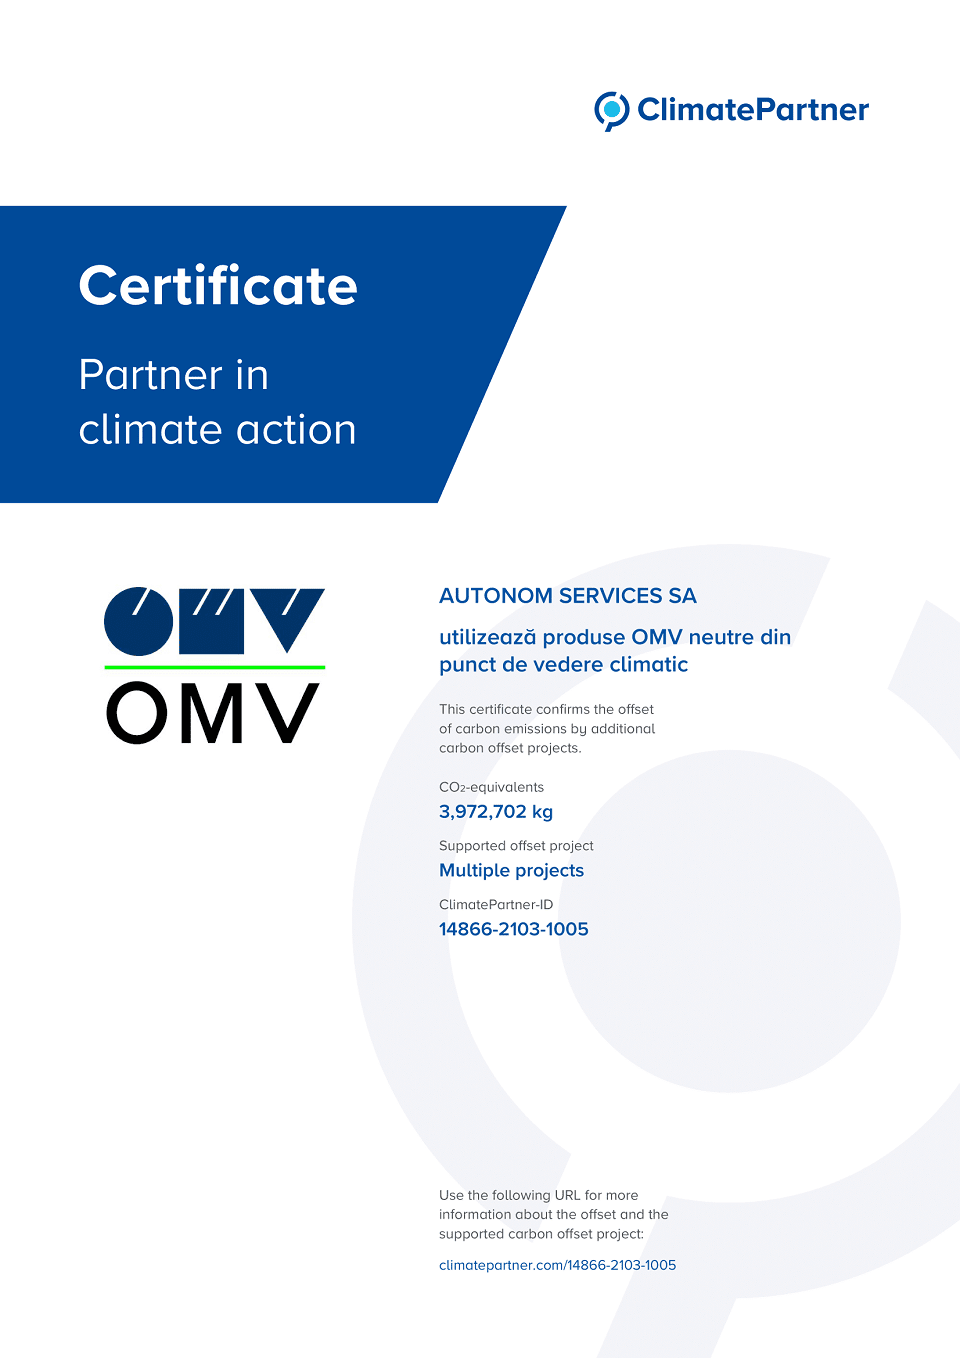
Our collaboration with OMV Petrom and their partnership with Climate Partner has also enabled us to offset some of the direct emissions related to the fuel rolled through this supplier. From March 2021 to date, we have received carbon certificates in the equivalent of 8,578 tonnes CO2e, of which in 2022, the equivalent of 4,475 tonnes CO2e.
As the fuel turnover is generated by direct use of the operational fleet, we consider that this value can partially cover the GHG emissions related to Scope 3, of course only as a supplementary measure to the efforts to reduce the negative impact of fleet size and the transition to a low emission fleet.
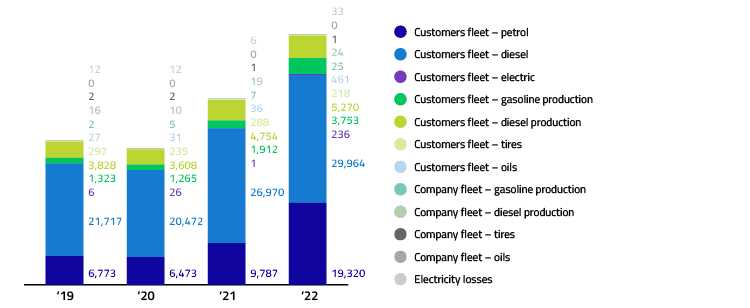
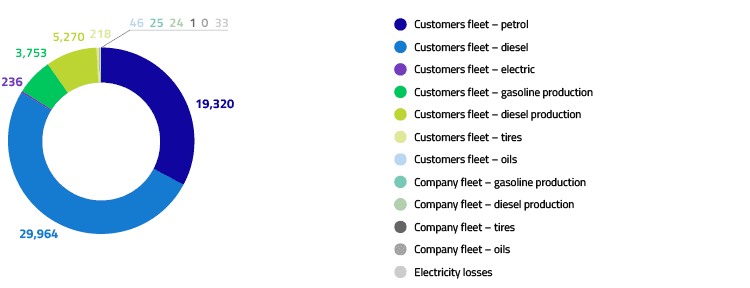
Our main source of emissions remains Scope 3, responsible for more than 99% of total emissions at Autonom.
In 2022, diesel cars are responsible for 51%, petrol cars for 33% and electric cars for 1% of total Scope 3 GHG emissions. 15% of our Scope 3 emissions are related to the production of diesel and petrol fuel used by our customers, while less than 1% are emissions related to oil and tyre use.
The largest share of total emissions is still accounted for by the diesel fleet, as they serve the activity of most companies in the active operational fleet, with extensive mobility needs that cannot be met for the moment by electric cars alone. However, their share in the total decreased from 60% in 2021 to 46% in 2022.
An important observation to note is the decrease in the intensity of emissions per km, namely, the total kilometres travelled by our customers increased by 88% in 2022 compared to baseline 2020, while the increase in emissions related to the fleet used by them was limited to 83%. This efficiency improvement confirms the downward trend required to achieve medium and long-term targets around emissions andgives us a better perspective of where we have the greatest indirect impact.
In 2023, we will intensify our focus on transitioning to a greener fleet with less impact on the environment and we are confident that we will close the current gap to the annual interim targets estimated in the Sustainability Strategy.
Total GHG emissions (gCO2/km)
Regarding the alignment with the SBTi (Science Based Targets Initiative) scenarios on environmental impact reduction, given the Target modelling for 2DS (2 degrees Celsius), in line with the SBTi transport calculation tool (https://sciencebasedtargets.org/sectors/transport), we have updated the calculation by including data for the active operational fleet at 2022 level:
Comparative analysis WLTP vs SBTi
The benchmarking analysis shows the potential intensity reduction needed for our fleet emissions and the main areas that need to be considered for fleet substitution to meet the compliance rate required by the EU Directive and create added value for the reduction of our total footprint. This comparison considers direct linear decrease options for WLTP and could reflect a potential substitution effort.
This analysis confirms the downward emissions trend for the 2022 operational fleet, like the other results presented above.